Dashboards & KPI reporting
Bring sales, finance, HR or operations metrics into an organized view your team can understand.
Excel / Power BI / Google SheetsDAMMAM, SAUDI ARABIA · WORKING WORLDWIDE
I’m Muzammil. I turn scattered spreadsheets into clear dashboards and reliable reporting workflows—built around the way your business works.
Excel · Power BI · Power Query · Google Sheets
Revenue is above target, but one segment contributes 48%. Monitor concentration alongside growth.
EXPLORE THE TABS · ILLUSTRATIVE DATA, NOT CLIENT RESULTS
01 / WHAT I CAN HELP WITH
A single workbook fix or a complete reporting workflow. Start with the problem you need to solve.
Bring sales, finance, HR or operations metrics into an organized view your team can understand.
Excel / Power BI / Google SheetsCombine recurring exports, transform your data and simplify the steps behind your weekly or monthly reports.
Power Query / Excel workflowsClean inconsistent data, merge files, remove duplicates and repair formulas so your reports have a stronger foundation.
Data preparation / Formulas02 / SELECTED WORK
See the story behind the numbers: revenue against target, gross profit, monthly momentum and the regions that need attention.
Sales exceeded the overall target, while regional performance varies. Compare each region against its target to identify where action is needed.
 Open project ↗
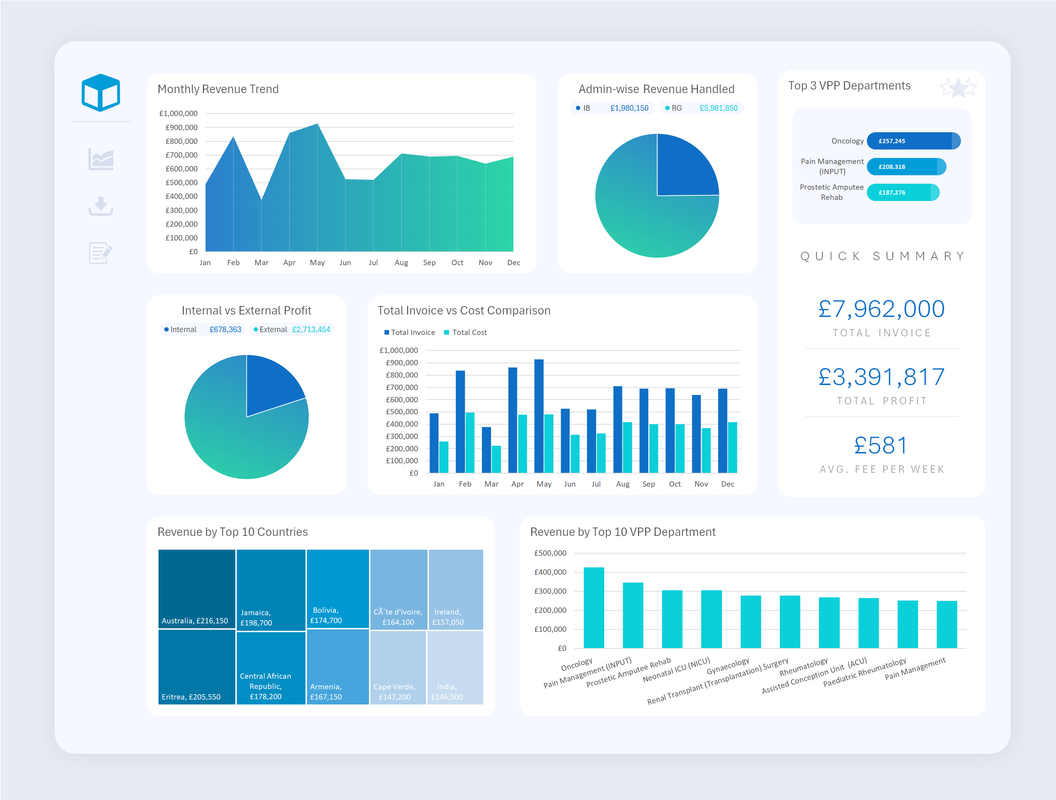
A consolidated dashboard for monthly revenue, costs and department-level performance using existing exported data.
Decision focus: compare department profitability and invoice-versus-cost performance in one reporting view.
Connect headcount, hiring, turnover and attendance in one clear view—so staffing decisions start with the right information.
The team grew by 20, but 6 critical roles remain open and attendance is below goal. See where to focus hiring and follow-up.
03 / YOUR REPORTING PARTNER
Based in Dammam, I work with business owners and teams who need clearer reporting and fewer repetitive spreadsheet tasks. My reporting work spans finance, HR, sales and operations.
Explore my experience ↗We discuss your current files, reporting needs and intended users.
We agree on scope, price and timeline before the work begins.
We review the result together and walk through how to use it.
LET’S SIMPLIFY YOUR REPORTING
Tell me what you’re working on. We’ll start with a conversation about your needs.
+966 56 414 1864·Dammam, Saudi Arabia